3D Bar Chart with Matplotlib
In this Matplotlib tutorial, we cover the 3D bar chart. The 3D bar chart is quite unique, as it allows us to plot more than 3 dimensions. No, you cannot plot past the 3rd dimension, but you can plot more than 3 dimensions.
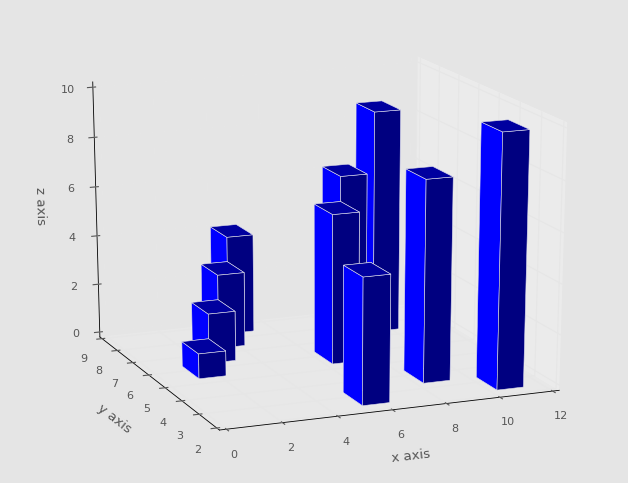
With bars, you have the starting point of the bar, the height of the bar, and the width of the bar. With a 3D bar, you also get another choice, which is depth of the bar. Most of the time, a bar chart starts with the bar flat on an axis, but you can add another dimension by releasing this constraint as well. We'll keep it rather simple, however:
from mpl_toolkits.mplot3d import axes3d
import matplotlib.pyplot as plt
import numpy as np
from matplotlib import style
style.use('ggplot')

fig = plt.figure()
ax1 = fig.add_subplot(111, projection='3d')

x3 = [1,2,3,4,5,6,7,8,9,10]
y3 = [5,6,7,8,2,5,6,3,7,2]
z3 = np.zeros(10)

dx = np.ones(10)
dy = np.ones(10)
dz = [1,2,3,4,5,6,7,8,9,10]

ax1.bar3d(x3, y3, z3, dx, dy, dz)


ax1.set_xlabel('x axis')
ax1.set_ylabel('y axis')
ax1.set_zlabel('z axis')

plt.show()
Note here that we have to define x,y,z... and then 3 more dimensions for depth. This gives us:

-
Introduction to Matplotlib and basic line
-
Legends, Titles, and Labels with Matplotlib
-
Bar Charts and Histograms with Matplotlib
-
Scatter Plots with Matplotlib
-
Stack Plots with Matplotlib
-
Pie Charts with Matplotlib
-
Loading Data from Files for Matplotlib
-
Data from the Internet for Matplotlib
-
Converting date stamps for Matplotlib
-
Basic customization with Matplotlib
-
Unix Time with Matplotlib
-
Colors and Fills with Matplotlib
-
Spines and Horizontal Lines with Matplotlib
-
Candlestick OHLC graphs with Matplotlib
-
Styles with Matplotlib
-
Live Graphs with Matplotlib
-
Annotations and Text with Matplotlib
-
Annotating Last Price Stock Chart with Matplotlib
-
Subplots with Matplotlib
-
Implementing Subplots to our Chart with Matplotlib
-
More indicator data with Matplotlib
-
Custom fills, pruning, and cleaning with Matplotlib
-
Share X Axis, sharex, with Matplotlib
-
Multi Y Axis with twinx Matplotlib
-
Custom Legends with Matplotlib
-
Basemap Geographic Plotting with Matplotlib
-
Basemap Customization with Matplotlib
-
Plotting Coordinates in Basemap with Matplotlib
-
3D graphs with Matplotlib
-
3D Scatter Plot with Matplotlib
-
3D Bar Chart with Matplotlib
-
Conclusion with Matplotlib
