Testing NLTK and Stanford NER Taggers for Accuracy
Guest Post by Chuck Dishmon
We know how to use two different NER classifiers! But which one should we choose, NLTK's or Stanford's? Let's do some testing to find out.
The first thing we'll need is some annotated reference data on which to test our NER classifiers. One way to get this data would be to find lots of articles and label each token as a type of named entity (e.g., person, organization, location) or other non-named entity. Then we could test our separate NER classifiers against the labels we know are correct.
Unfortunately, this would be really time consuming! Good thing there's a manually annotated dataset available for free with over 16,000 English sentences. There are also datasets available in German, Spanish, French, Italian, Dutch, Polish, Portuguese, and Russian!
Here's one annotated sentence from the dataset:
Founding O
member O
Kojima I-PER
Minoru I-PER
played O
guitar O
on O
Good I-MISC
Day I-MISC
, O
and O
Wardanceis I-MISC
cover O
of O
a O
song O
by O
UK I-LOC
post O
punk O
industrial O
band O
Killing I-ORG
Joke I-ORG
. O
Let's read, split, and manipulate the data so it's in a better format for testing.
import nltk
from nltk.tag import StanfordNERTagger
from nltk.metrics.scores import accuracy

raw_annotations = open("/usr/share/wikigold.conll.txt").read()
split_annotations = raw_annotations.split()

# Amend class annotations to reflect Stanford's NERTagger
for n,i in enumerate(split_annotations):
	if i == "I-PER":
		split_annotations[n] = "PERSON"
	if i == "I-ORG":
		split_annotations[n] = "ORGANIZATION"
	if i == "I-LOC":
		split_annotations[n] = "LOCATION"

# Group NE data into tuples
def group(lst, n):
  for i in range(0, len(lst), n):
	val = lst[i:i+n]
	if len(val) == n:
	  yield tuple(val)

reference_annotations = list(group(split_annotations, 2))
Ok, that looks good! But we'll also need the “clean” form of that data to stick into our NER classifiers. Let's make that happen too.
pure_tokens = split_annotations[::2]
This reads in the data, splits it by spacing, then subsets everything in split_annotations by an increment of 2 (starting with the 0th element). This produces a dataset like the following (much smaller) example:
['Founding', 'member', 'Kojima', 'Minoru', 'played', 'guitar', 'on', 'Good', 'Day', ',', 'and', 'Wardanceis', 'cover', 'of', 'a', 'song', 'by', 'UK', 'post', 'punk', 'industrial', 'band', 'Killing', 'Joke', '.']
Let's go ahead and test the NLTK classifier.
tagged_words = nltk.pos_tag(pure_tokens)
nltk_unformatted_prediction = nltk.ne_chunk(tagged_words)
Since the NLTK NER classifier produces trees (including POS tags), we'll need to do some additional data manipulation to get it in a proper form for testing.
#Convert prediction to multiline string and then to list (includes pos tags)
multiline_string = nltk.chunk.tree2conllstr(nltk_unformatted_prediction)
listed_pos_and_ne = multiline_string.split()

# Delete pos tags and rename
del listed_pos_and_ne[1::3]
listed_ne = listed_pos_and_ne

# Amend class annotations for consistency with reference_annotations
for n,i in enumerate(listed_ne):
	if i == "B-PERSON":
		listed_ne[n] = "PERSON"
	if i == "I-PERSON":
		listed_ne[n] = "PERSON"
	if i == "B-ORGANIZATION":
		listed_ne[n] = "ORGANIZATION"
	if i == "I-ORGANIZATION":
		listed_ne[n] = "ORGANIZATION"
	if i == "B-LOCATION":
		listed_ne[n] = "LOCATION"
	if i == "I-LOCATION":
		listed_ne[n] = "LOCATION"
	if i == "B-GPE":
		listed_ne[n] = "LOCATION"
	if i == "I-GPE":
		listed_ne[n] = "LOCATION"

# Group prediction into tuples
nltk_formatted_prediction = list(group(listed_ne, 2))
Now we can test the accuracy of NLTK:
nltk_accuracy = accuracy(reference_annotations, nltk_formatted_prediction)
print(nltk_accuracy)
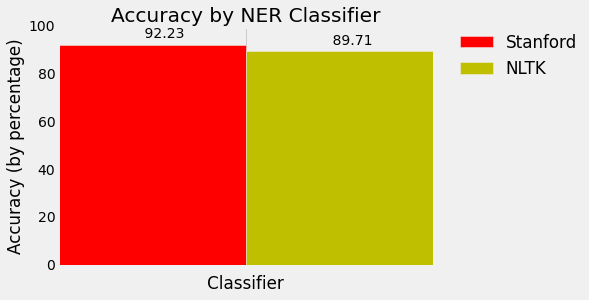
Wow, .8971 accurate!
Now let's test the Stanford classifier. Since this classifier produces output in tuples, testing doesn't require more data manipulation.
st = StanfordNERTagger('/usr/share/stanford-ner/classifiers/english.all.3class.distsim.crf.ser.gz',
					   '/usr/share/stanford-ner/stanford-ner.jar',
					   encoding='utf-8')
stanford_prediction = st.tag(pure_tokens)
stanford_accuracy = accuracy(reference_annotations, stanford_prediction)
print(stanford_accuracy)
Sheesh, .9223 accuracy! Even better!
If you'd like to visualize this, here's some extra code. Check out the matplotlib series if you'd like to figure out more about how this works:
import numpy as np
import matplotlib.pyplot as plt
from matplotlib import style

style.use('fivethirtyeight')

N = 1
ind = np.arange(N)  # the x locations for the groups
width = 0.35       # the width of the bars

fig, ax = plt.subplots()

stanford_percentage = stanford_accuracy * 100
rects1 = ax.bar(ind, stanford_percentage, width, color='r')

nltk_percentage = nltk_accuracy * 100
rects2 = ax.bar(ind+width, nltk_percentage, width, color='y')

# add some text for labels, title and axes ticks
ax.set_xlabel('Classifier')
ax.set_ylabel('Accuracy (by percentage)')
ax.set_title('Accuracy by NER Classifier')
ax.set_xticks(ind+width)
ax.set_xticklabels( ('') )

ax.legend( (rects1[0], rects2[0]), ('Stanford', 'NLTK'), bbox_to_anchor=(1.05, 1), loc=2, borderaxespad=0. )

def autolabel(rects):
	# attach some text labels
	for rect in rects:
		height = rect.get_height()
		ax.text(rect.get_x()+rect.get_width()/2., 1.02*height, '%10.2f' % float(height),
				ha='center', va='bottom')

autolabel(rects1)
autolabel(rects2)

plt.show()
-
Tokenizing Words and Sentences with NLTK
-
Stop words with NLTK
-
Stemming words with NLTK
-
Part of Speech Tagging with NLTK
-
Chunking with NLTK
-
Chinking with NLTK
-
Named Entity Recognition with NLTK
-
Lemmatizing with NLTK
-
The corpora with NLTK
-
Wordnet with NLTK
-
Text Classification with NLTK
-
Converting words to Features with NLTK
-
Naive Bayes Classifier with NLTK
-
Saving Classifiers with NLTK
-
Scikit-Learn Sklearn with NLTK
-
Combining Algorithms with NLTK
-
Investigating bias with NLTK
-
Improving Training Data for sentiment analysis with NLTK
-
Creating a module for Sentiment Analysis with NLTK
-
Twitter Sentiment Analysis with NLTK
-
Graphing Live Twitter Sentiment Analysis with NLTK with NLTK
-
Named Entity Recognition with Stanford NER Tagger
-
Testing NLTK and Stanford NER Taggers for Accuracy
-
Testing NLTK and Stanford NER Taggers for Speed
-
Using BIO Tags to Create Readable Named Entity Lists
